Project Purpose:
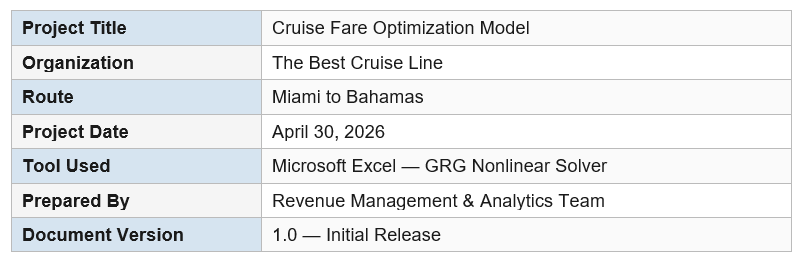
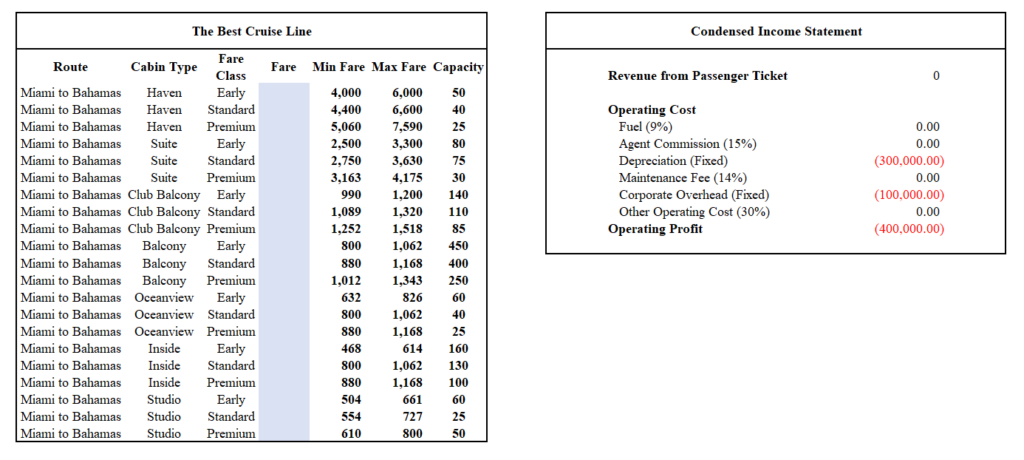
The Best Cruise Line operates (pseudo name) the Miami to Bahamas route offering seven cabin types (Haven, Suite, Club Balcony, Balcony, Oceanview, Inside, and Studio) across three fare classes (Early, Standard, and Premium). The purpose of this project is to determine the optimal fare per cabin type and fare class that maximizes operating profit while keeping fares within defined minimum and maximum bounds.
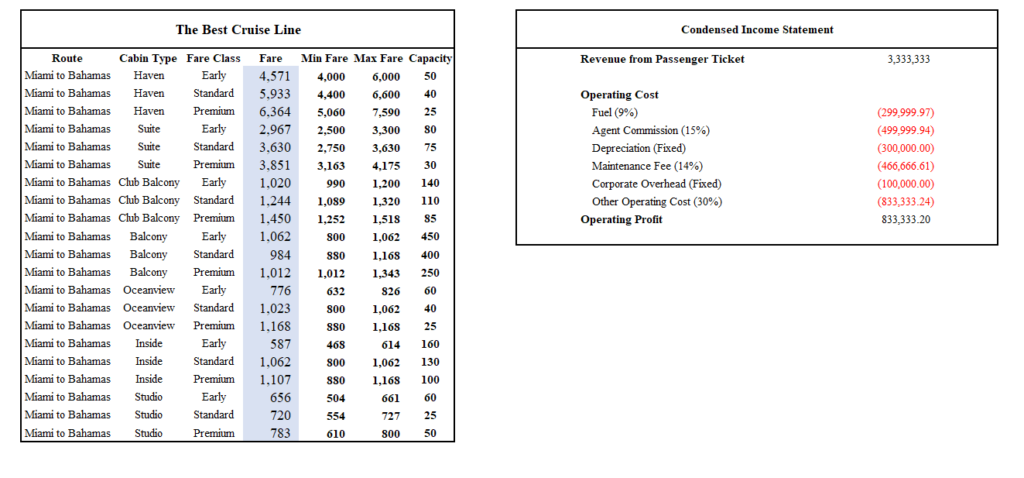
This project uses Excel’s GRG Nonlinear Solver to identify fare combinations that achieve a target operating profit of $833,333, based on a total revenue model driven by cabin capacity and cost structure.
Project Objective:
- Maximize operating profit across all cabin and fare class combinations on the Miami–Bahamas route.
- Set fares within defined Min Fare and Max Fare boundaries for each cabin type and fare class.
- Achieve a target operating profit equal to the baseline model ($833,333).
- Compare performance at 100% cabin factor (Version 1) versus 90% cabin factor (Version 2).
- Deliver a reproducible, Solver-driven Excel model that can be rerun as market conditions change.
Project Scope:
In Scope
- Fare optimization for 21 cabin/fare-class combinations (7 cabin types x 3 fare classes).
- Condensed Income Statement modeling: Revenue, Fuel (9%), Agent Commission (15%), Depreciation, Maintenance (14%), Corporate Overhead, and Other Operating Cost (30%).
- Two scenario analyses: 100% cabin factor and 90% cabin factor.
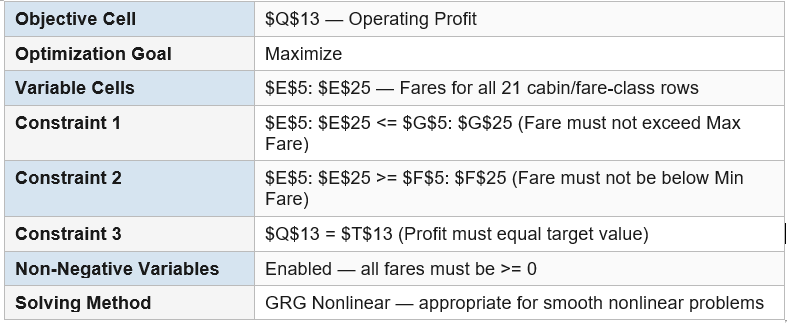
- Excel Solver configuration using GRG Nonlinear method.
Out of Scope
- Routes other than Miami to Bahamas.
- Dynamic pricing models or real-time market data integration.
- Onboard revenue (spa, dining, excursions).
- Multi-voyage or seasonal fare modeling.
Excel Solver Configuration:
Scenario Comparison

Why Revenue Is Equal Across Both Scenarios
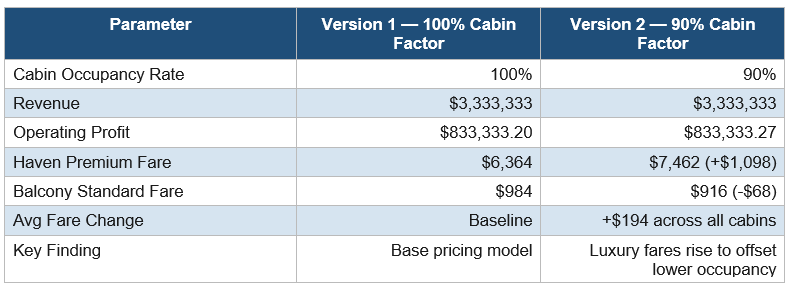
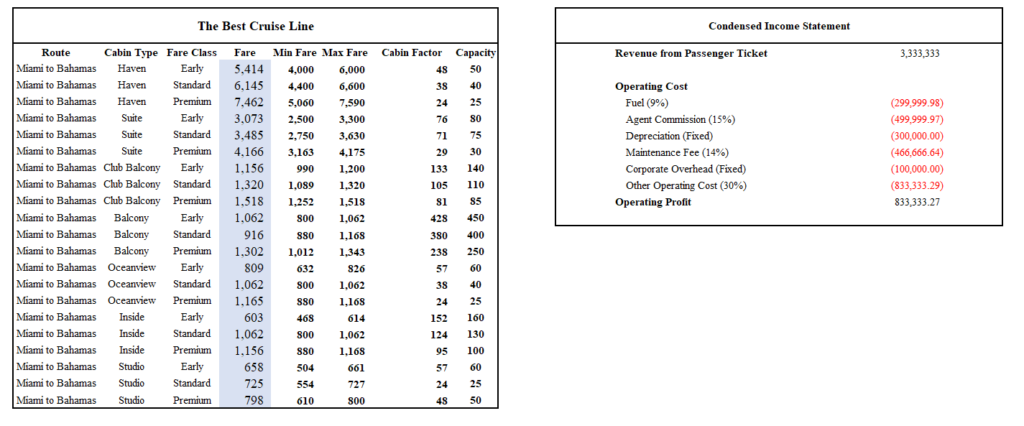
Both Version 1 (100% cabin factor) and Version 2 (90% cabin factor) produce identical passenger ticket revenue of $3,333,333. This is not a coincidence — it is the direct result of how the Excel Solver was configured and the fundamental relationship between occupancy and fare pricing.
The Revenue Formula: Revenue = Fare x Passengers, where Passengers = Capacity x Cabin Factor
When the cabin factor drops from 100% to 90%, fewer passengers are carried on each voyage. Left unchanged, this would reduce total revenue by approximately 10%. However, the Solver was given a constraint that operating profit must equal the target value ($833,333). To satisfy this constraint with fewer passengers, the Solver automatically increased fares across cabin types — especially premium cabins — so that the higher revenue-per-passenger exactly offsets the lower passenger count, resulting in the same total revenue.
This is classic yield management: fewer guests paying higher fares versus more guests paying lower fares — two strategies that can produce the same total revenue but have very different implications for customer experience, operational capacity, and market positioning.
Key Findings:
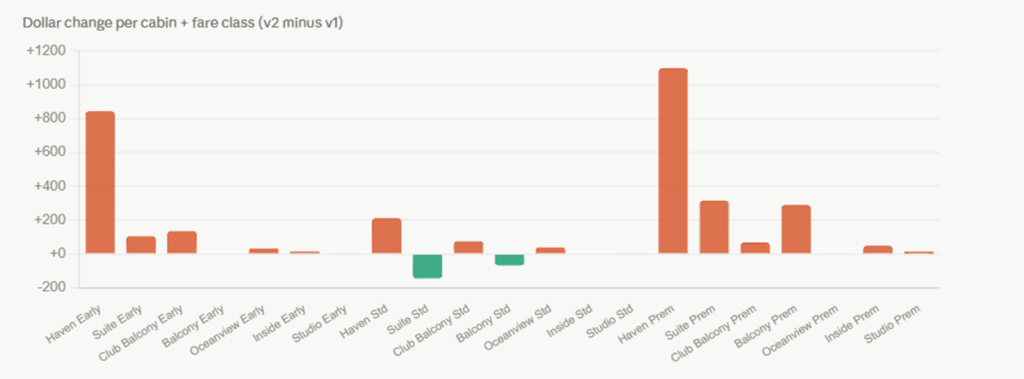
- At 90% cabin factor, the Solver raises fares — particularly for premium cabins — to maintain the same profit target, confirming that revenue yield management is critical at lower occupancy.
- Haven Premium shows the highest fare sensitivity: a 10% occupancy drop triggers a $1,098 fare increase (+17.3%) to compensate.
- Budget cabins (Studio, Inside) are largely price-stable across scenarios, reflecting limited pricing flexibility at the low end.
- Balcony Standard is the only fare that decreases at 90% occupancy (-$68), suggesting Solver found a more efficient revenue mix for that segment.
- Fixed costs (Depreciation $300K, Corporate Overhead $100K) remain unchanged across scenarios, making variable cost management the primary lever for profitability.
- The GRG Nonlinear Solver successfully finds feasible, bounded solutions in both scenarios, validating the model structure.
Assumptions
- All cabins sail at the stated cabin factor (100% or 90% respectively) for every voyage.
- Fares are fixed per voyage (no dynamic mid-voyage repricing).
- Cost percentages (Fuel 9%, Agent Commission 15%, Maintenance 14%, Other 30%) are applied uniformly against total ticket revenue.
- Fixed costs (Depreciation $300K, Corporate Overhead $100K) do not vary with occupancy.
Constraints
- Each fare must remain within its published Min Fare and Max Fare bounds.
- All fares must be non-negative.
- The Solver objective is constrained to equal the target profit, not exceed it, ensuring model stability.
Appendix 1:
Appendix 2: 100% cabin Factor (Base Case)
Appendix 3: 90% Cabin Factor
Full Project: